A crystal can be part of the instrument used to measure itself. That sounds like measuring a ruler with the same ruler. But there is a way to make it work—and it opens a useful window into how materials behave.
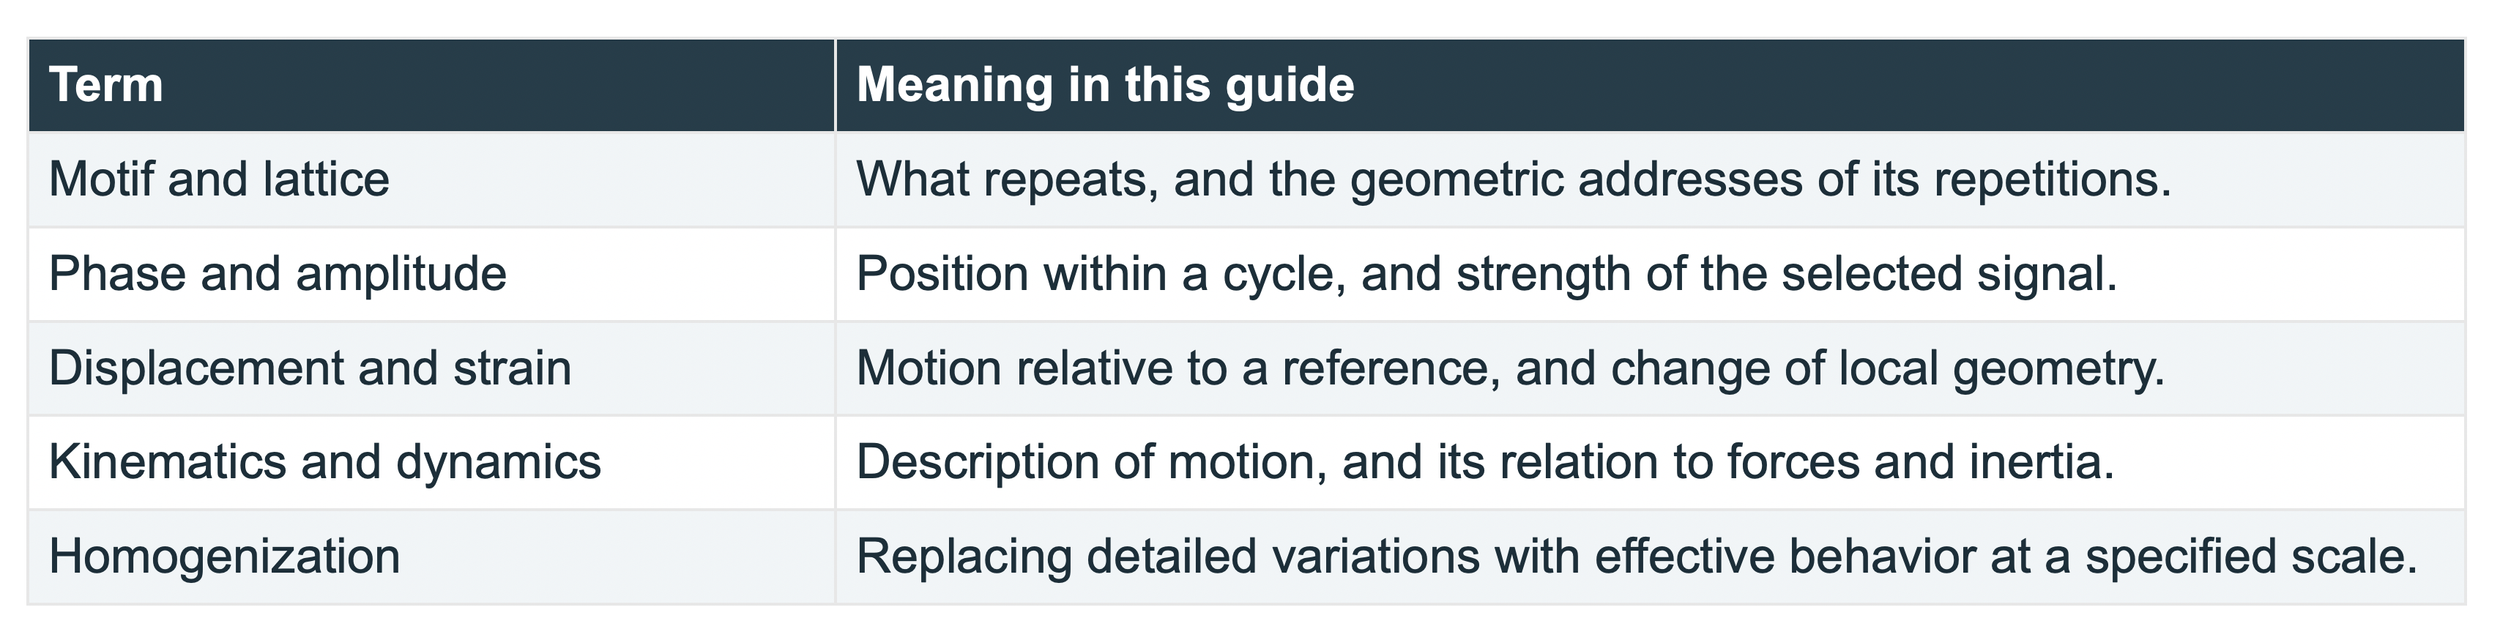
Let me explain what’s going on. A crystal contains a repeating arrangement of atoms. When the material stretches, twists, or develops a defect, that arrangement changes. Compare the changed pattern with a suitable reference, and the crystal becomes a built-in measuring gauge. The challenge is reading the change. This is where moiré enters the story. You have probably seen broad, moving bands when looking through two window screens. Neither screen contains those wide bands on its own. They appear because the two fine patterns are slightly out of step. A tiny change in alignment creates a much larger change in the bands. The pattern gives us a way to notice differences that would otherwise be hard to read. In a measurement system, we can use that same idea with recorded images and a computer. We call it moiré metrology. Metrology simply means the science of measurement.
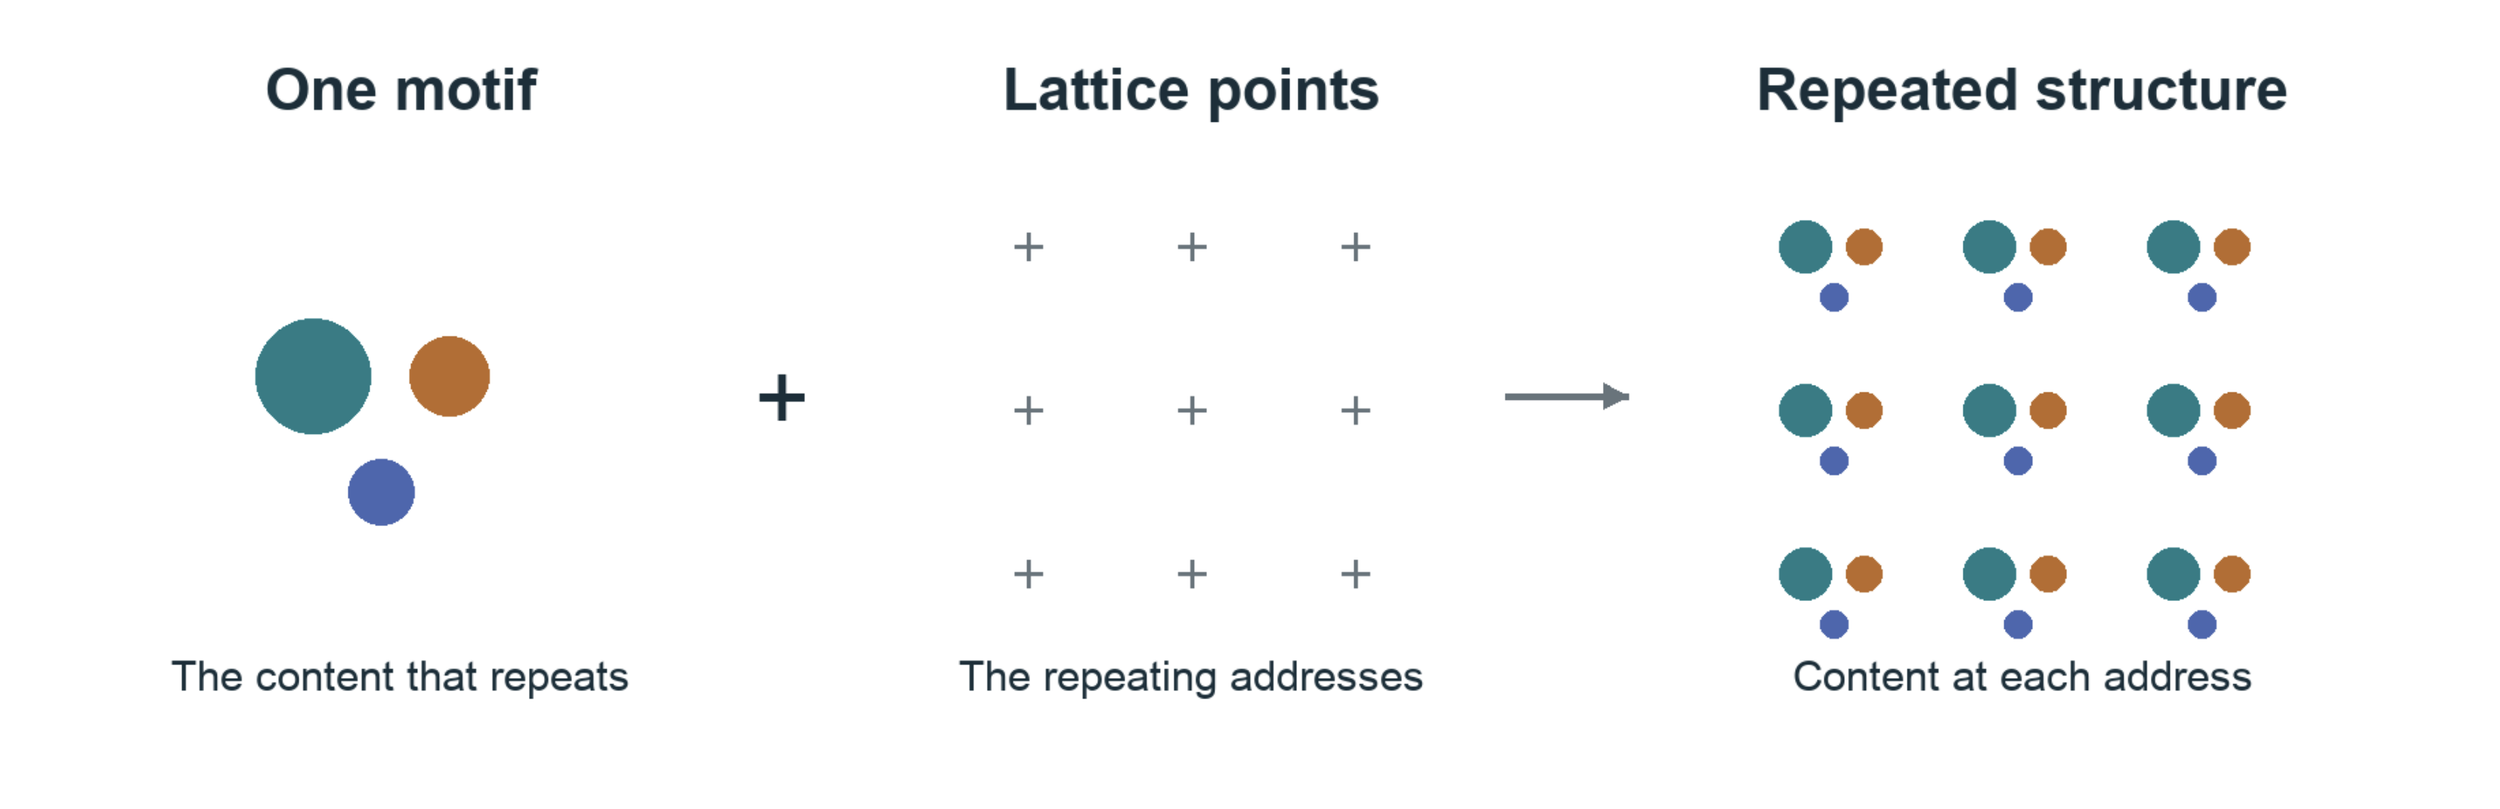
A unit crystal is a motif or unit cell that repeats. A teaching motif repeated on a simple lattice. The colors distinguish parts of the motif; this drawing is not the atomic structure of SiC.
The defect that tells a story
Picture a neat wall of tiles. Now imagine one row ending halfway through the wall. The tiles nearby must shift to make room. Something similar happens around a crystal defect called a dislocation. The regular arrangement is interrupted. Nearby regions can become crowded, stretched, or tilted. Those changes matter because defects can affect how a material carries force or performs in a device.
A 2019 study by Cesar A. Sciammarella, Federico M. Sciammarella, and Luciano Lamberti examined this problem in silicon carbide, or SiC. The researchers analyzed images recorded with a high-resolution electron microscope. They used the crystal’s repeating pattern to recover tiny shifts and map how deformation varied around dislocations. [1] The crystal supplied the pattern. The microscope recorded it. The analysis turned changes in that pattern into measurements. That chain is the heart of the story. We are using the structure of a material to learn how that structure has changed.
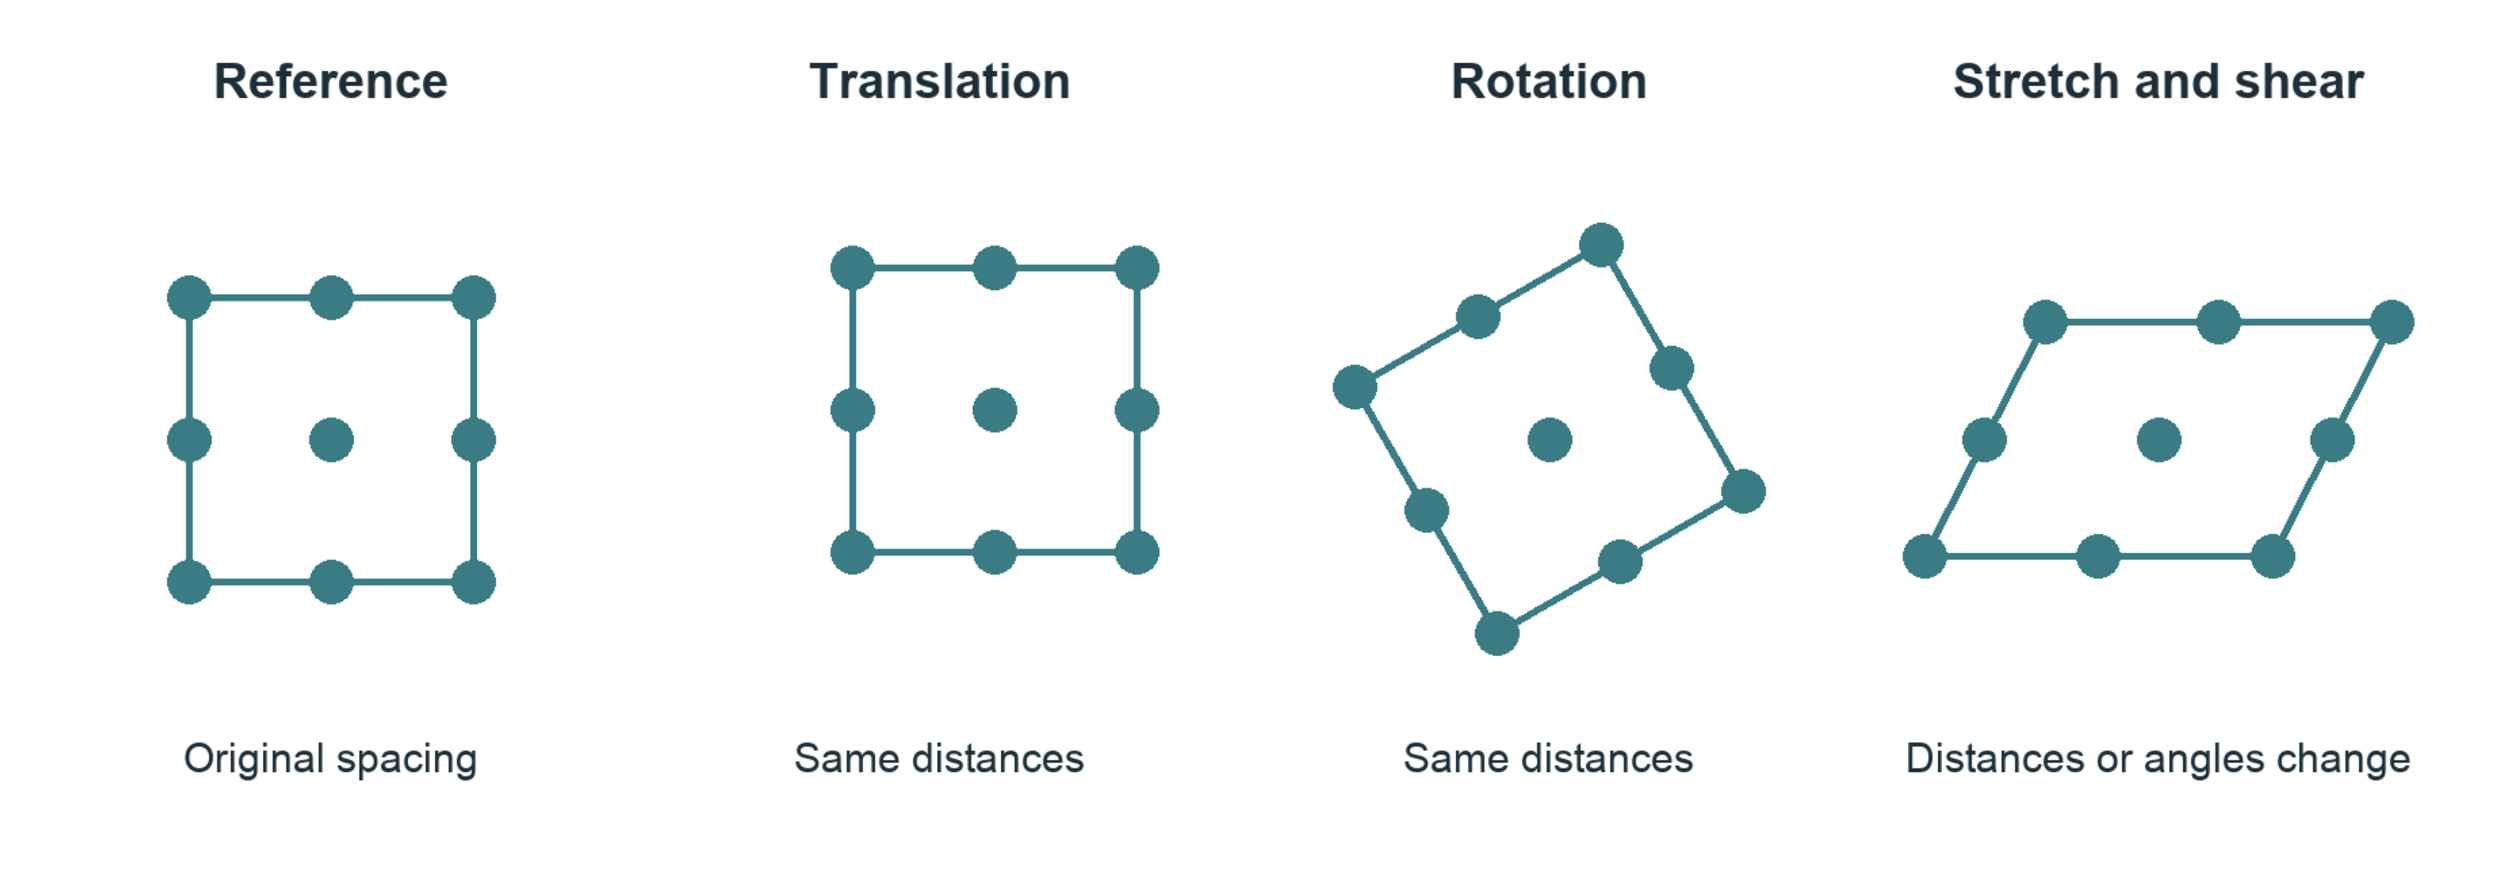
Translation and rigid rotation preserve shape. Stretch and shear alter the geometry. All four drawings use corresponding points.
One direction cannot tell the whole story
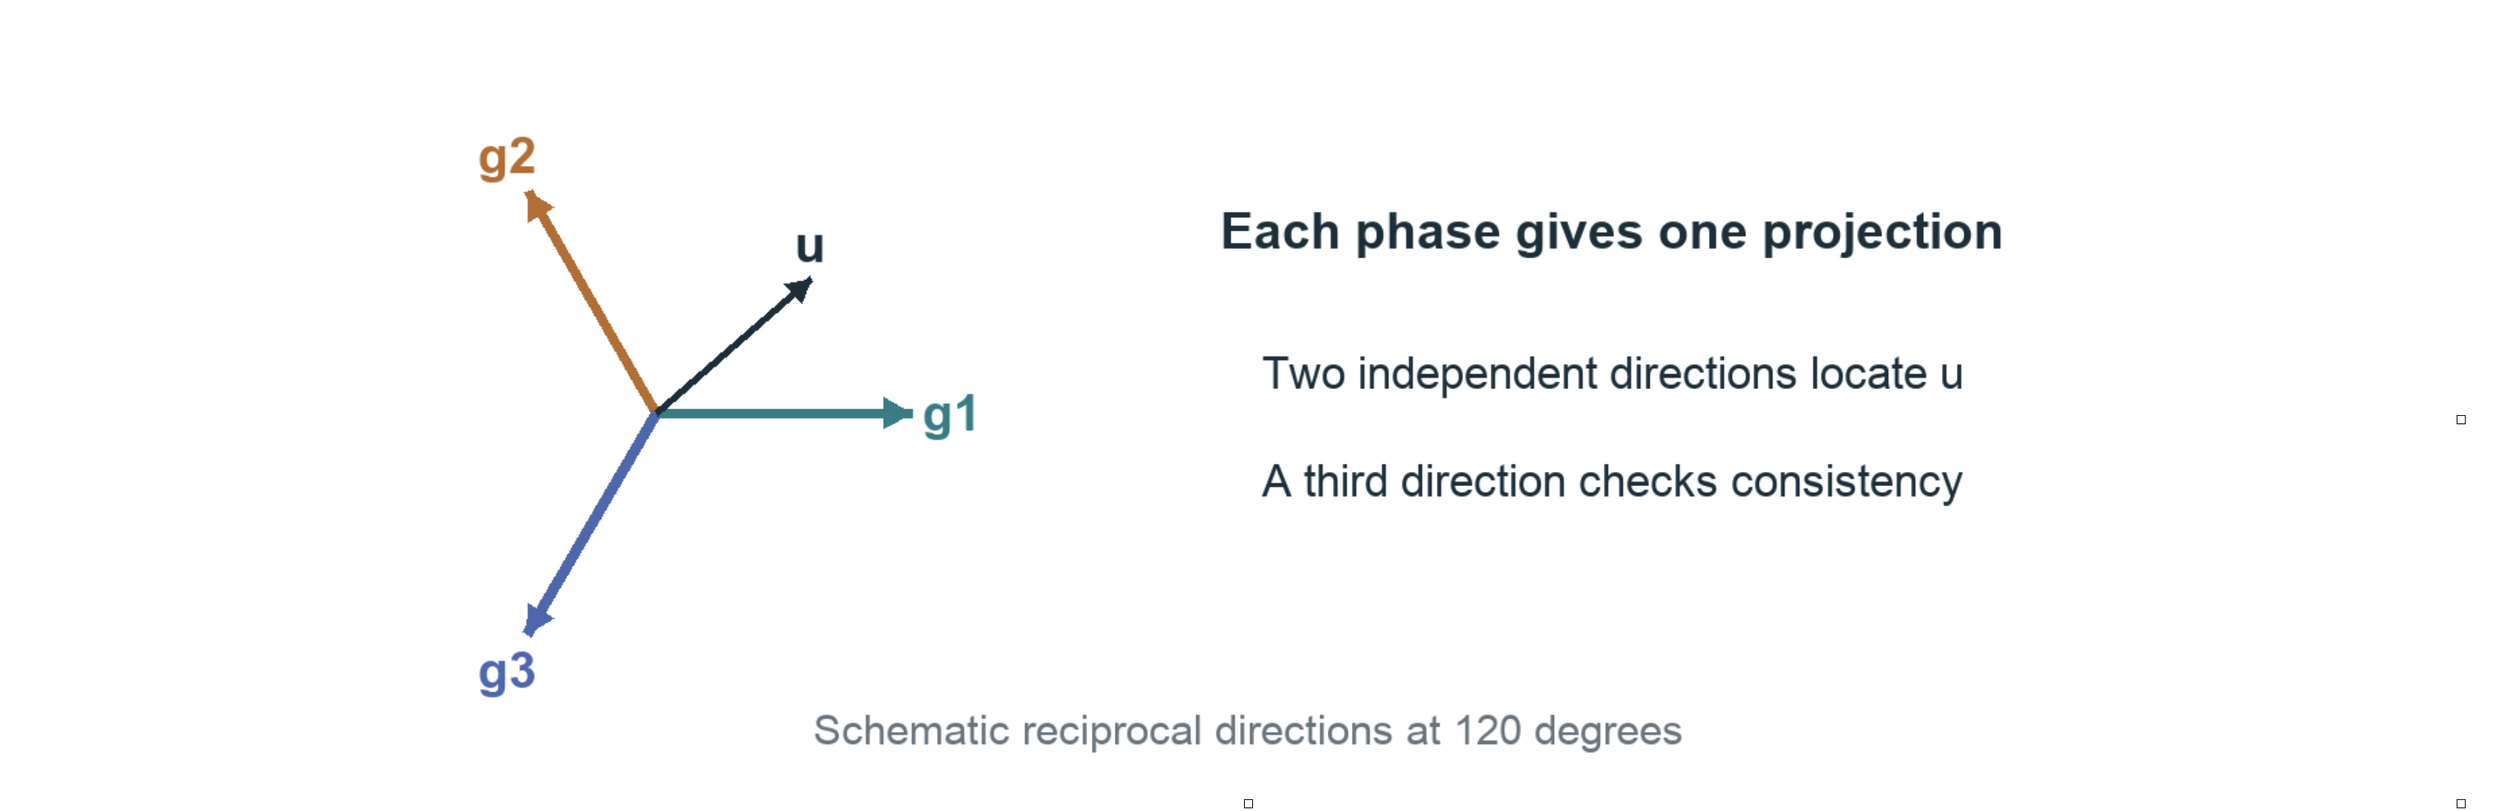
Imagine watching a person through a narrow doorway. You might see them move left or right while missing movement toward you. A single set of parallel crystal fringes has a similar blind spot. It reveals movement across the fringes, while movement along them can remain hidden. Looking at suitable patterns in different directions helps fill in the picture. In the SiC study, three directions provide a way to connect the crystal geometry with a map of motion. The extra direction also gives the measurements a chance to disagree. That is useful: disagreement can reveal a weak reference, an imaging problem, or a place where the model needs more care. A good measuring method needs ways to catch itself being wrong.
Where our models meet the material
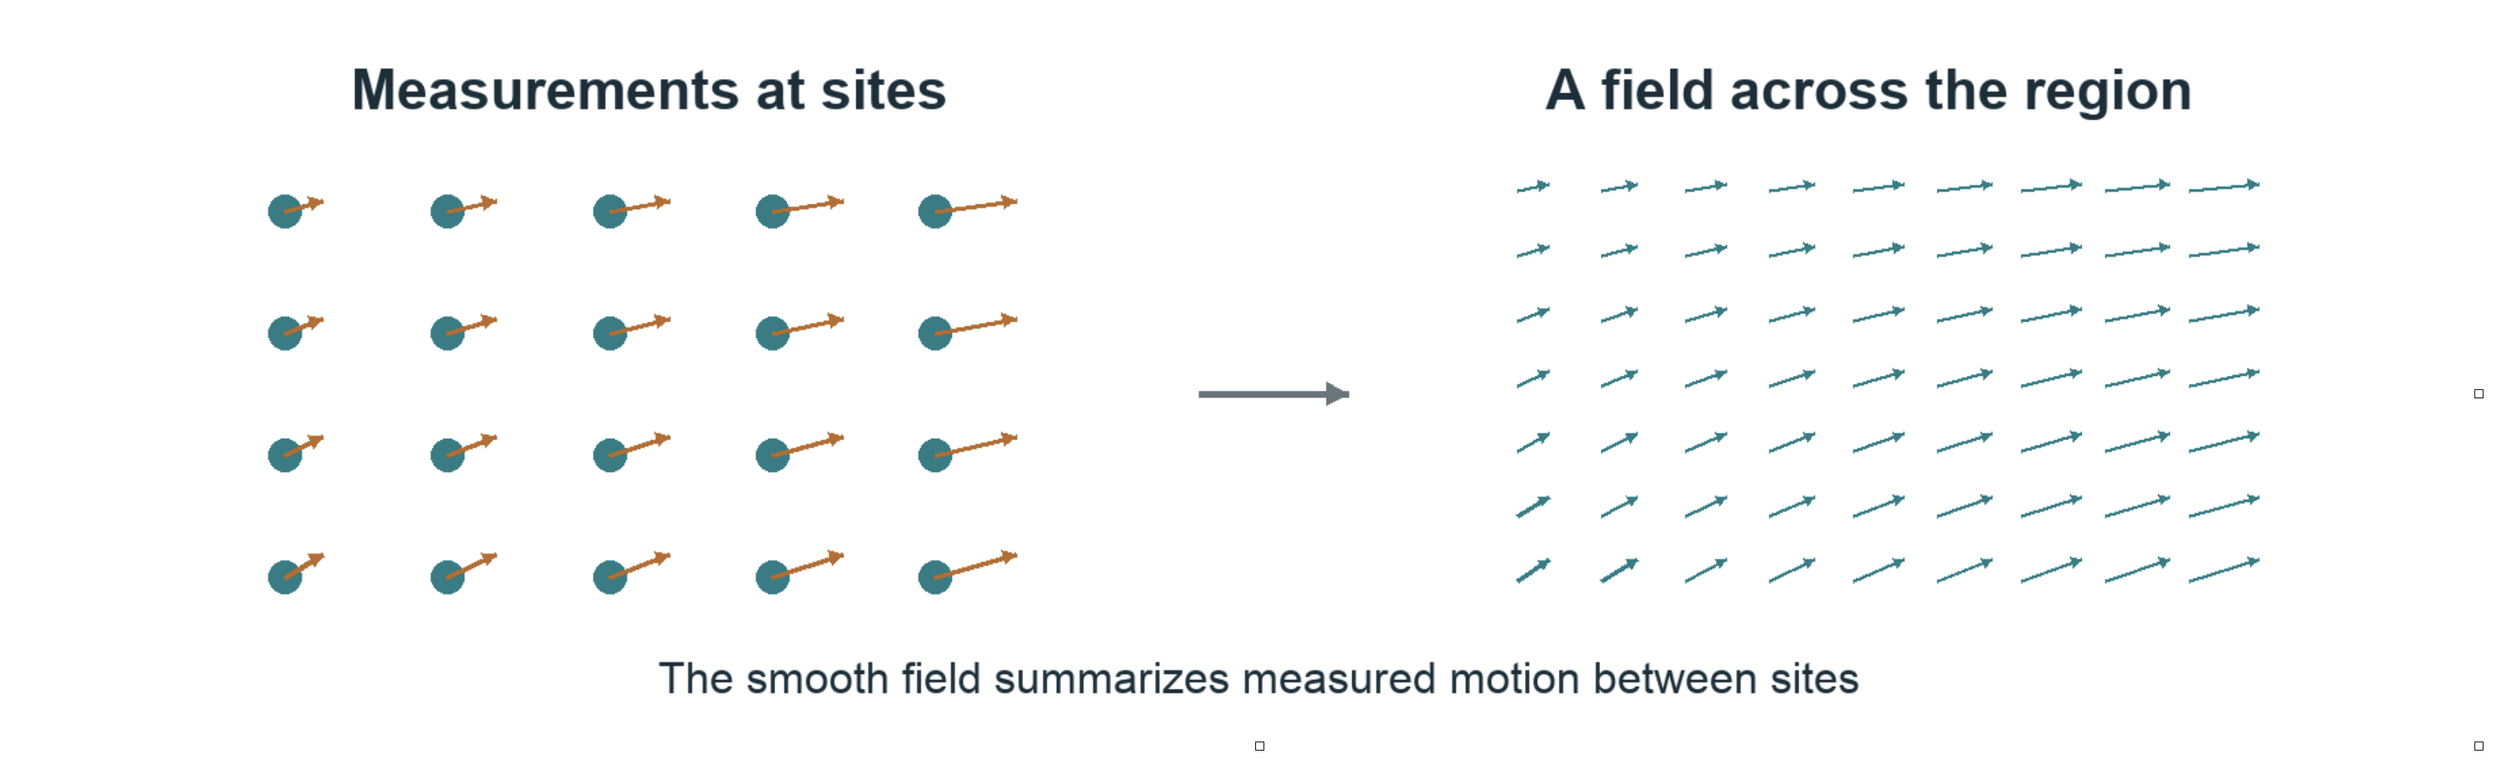
Engineers often describe a material as if it were a smooth sheet. Atoms, of course, come in separate pieces. Both views can help us. The question is where the smooth description remains useful—and where it starts to miss something important. Far from a defect, a small patch of crystal may stretch in a fairly regular way. Close to a defect, neighboring atoms can rearrange in ways that a simple stretch cannot describe.
Moiré measurements let us test that boundary. We can compare the motion suggested by a smooth model with changes in the recorded crystal pattern. Where they agree, we gain evidence that the model works for that region and scale. Where they disagree, we have something worth investigating. The SiC paper offers evidence for this connection under the conditions it studied. It does not settle the question for every material or every defect. This is what makes the approach interesting: measurement can help us decide which model deserves our trust.
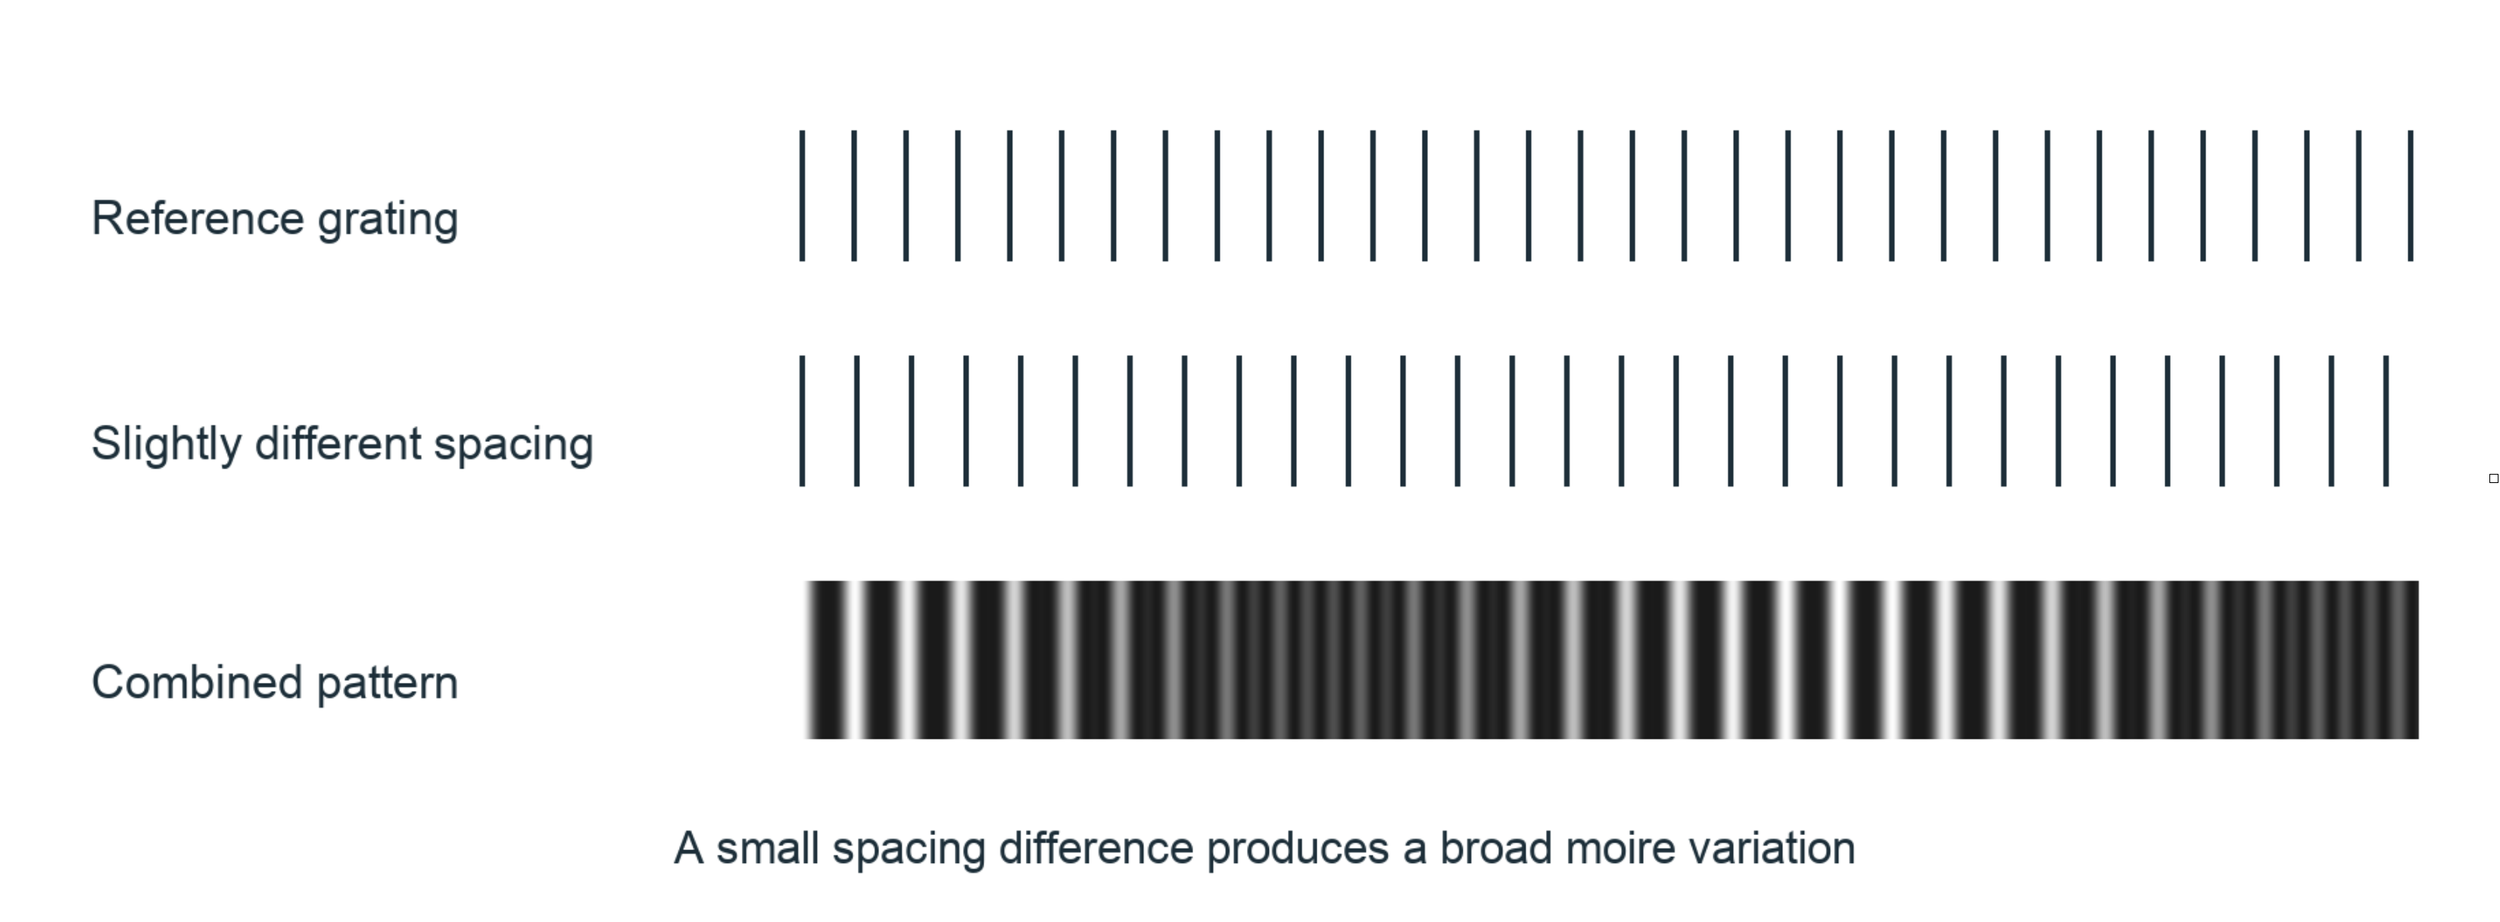
Light is part of the experiment
There is a catch. A microscope image is shaped by the instrument as well as the sample. Focus, viewing angle, sample thickness, and the way waves interact with the material can all change what appears in an image. A dark spot is not a direct reading of atomic force. A brighter region does not automatically mean more atoms. We have to understand how the image was formed before we decide what it means. This also matters when connecting the SiC work with NanoFraction’s nanoscope. The atomic-scale study used electrons. It does not, by itself, show that a visible-light nanoscope can resolve individual atoms.
The connection is the measurement approach: find a useful pattern, compare it with a reference, recover changes, and test what those changes tell us. Each instrument must establish which information it actually records. Detecting a very small shift is also different from seeing two very small objects as separate objects. A gauge can be sensitive to motion much smaller than the finest detail in its image. Those are different abilities, and each needs its own test.
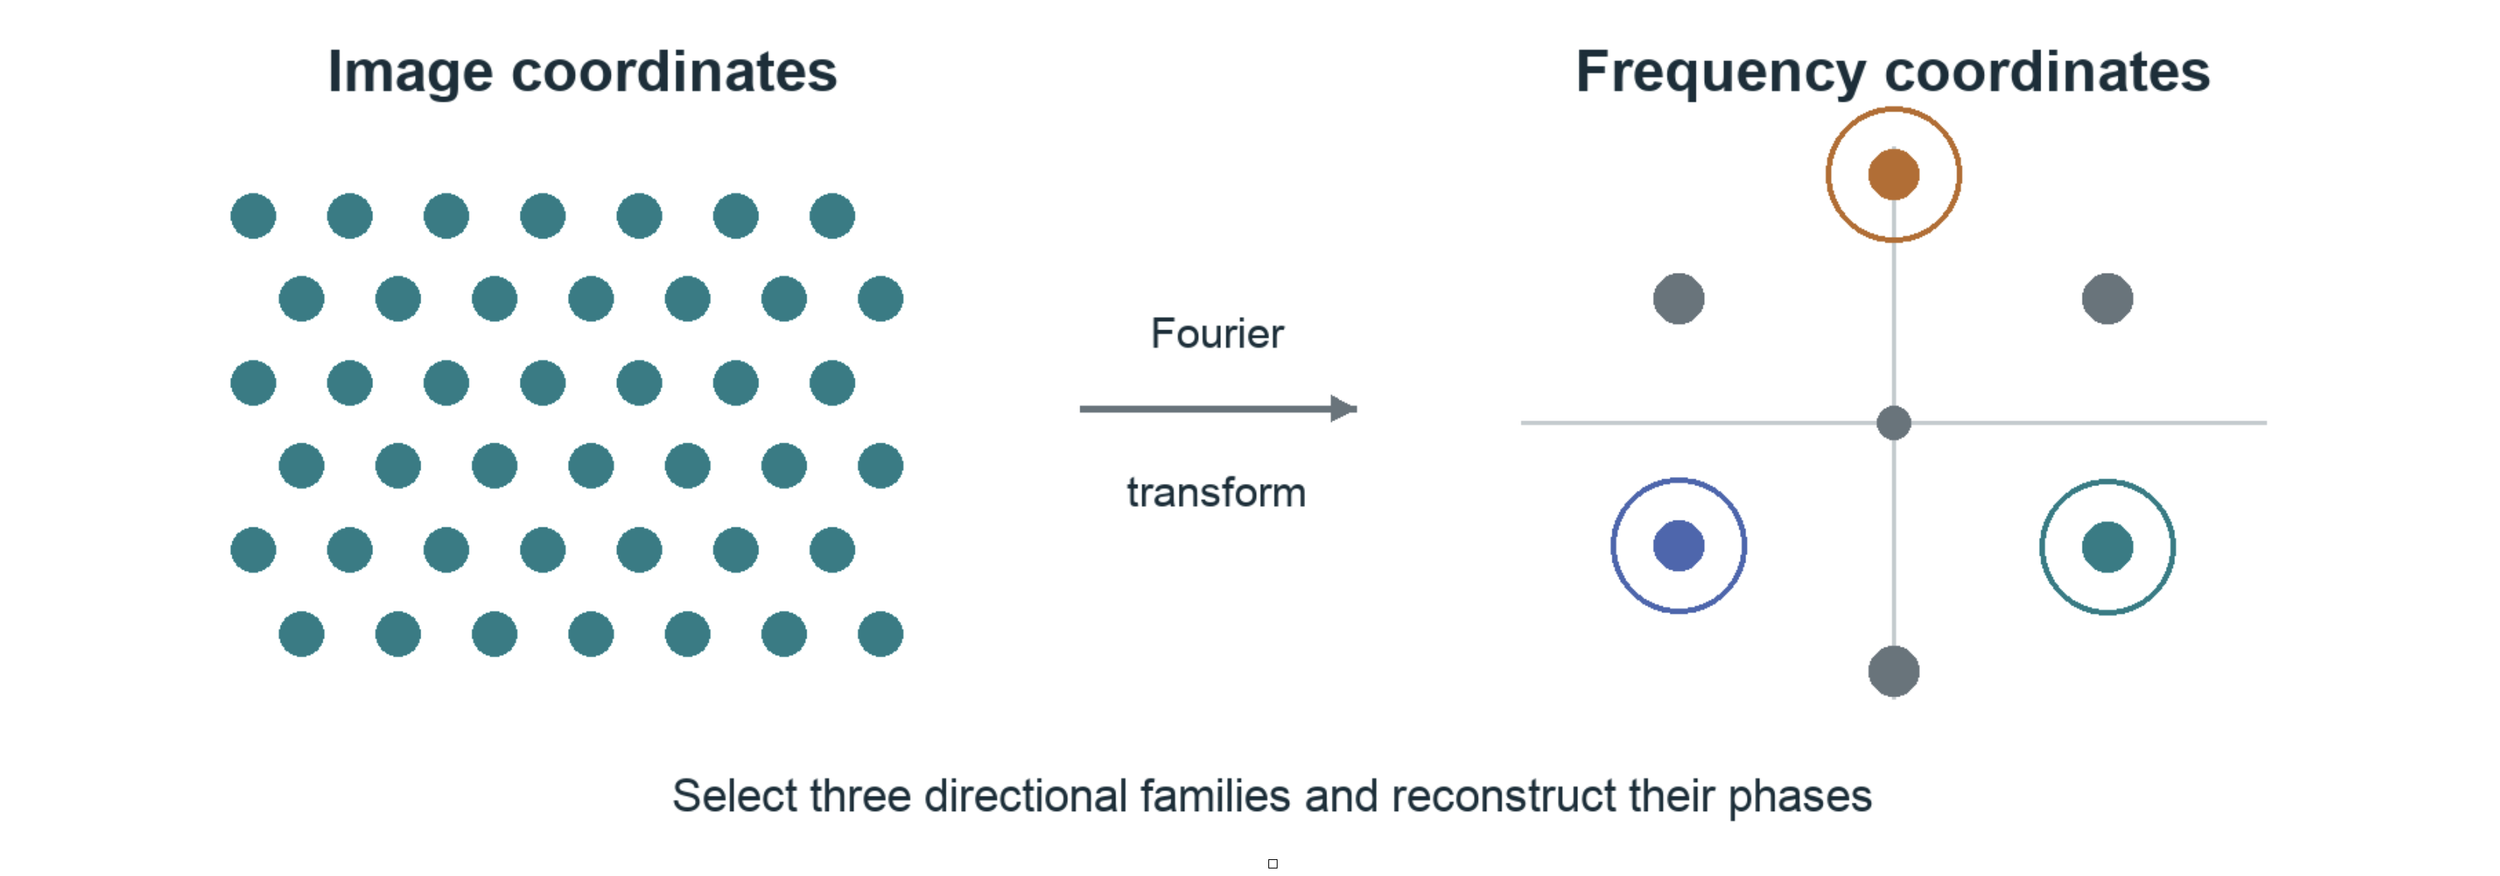
A rehearsal room for the experiment
This is the role we envision for the SiC Holomoire library alongside the nanoscope: a place to connect an observed pattern with a testable explanation. The nanoscope brings observations from the physical sample. The library provides a framework for exploring how a crystal pattern, its deformation, and the analysis might fit together. Think of it as a rehearsal room. Before asking an unfamiliar image to reveal its secrets, we can ask a simpler question: if we already knew how a pattern had moved, could our analysis recover that movement?
Then we can make the problem harder. What happens when the pattern rotates? When contrast fades? When noise rises? When a defect interrupts the repeating structure These are the kinds of controlled comparisons that make a companion library valuable. They help separate a promising interpretation from a result that depends too heavily on one processing choice. Features and performance still need to be demonstrated against the actual implementation. A simulation that recovers what we put into it checks the analysis. Agreement with an independent experiment is the next, harder test. For a research partner, the opportunity is practical: use that loop to choose better experiments, examine competing explanations, and learn which measurements remain dependable as conditions change.
Building a bridge we can test
Moving across scales requires more than a powerful image. We need to know what counts as an unchanged reference. We need to repeat measurements on a sample that is not changing. We need to check whether a result survives reasonable changes in the analysis. And we need another way to check the answer when possible. As we look at larger regions, we also need to ask what gets lost. Averaging can reveal a broad trend while hiding the defect that matters most. That is the scaffolding for a useful bridge between scales. Moiré supplies a shared way to read changes in repeating patterns. Careful experiments establish how far that bridge reaches.
The promise behind the crystal gauge is that matter already contains structure we can use to ask better questions. Pair that structure with experimental optics, a suitable reference, and software that can be tested, and we gain a way to investigate how local changes connect with larger behavior. With the nanoscope and SiC Holomoire working together, that is the direction we want to pursue: observations that challenge the model, and models that help us design the next observation.
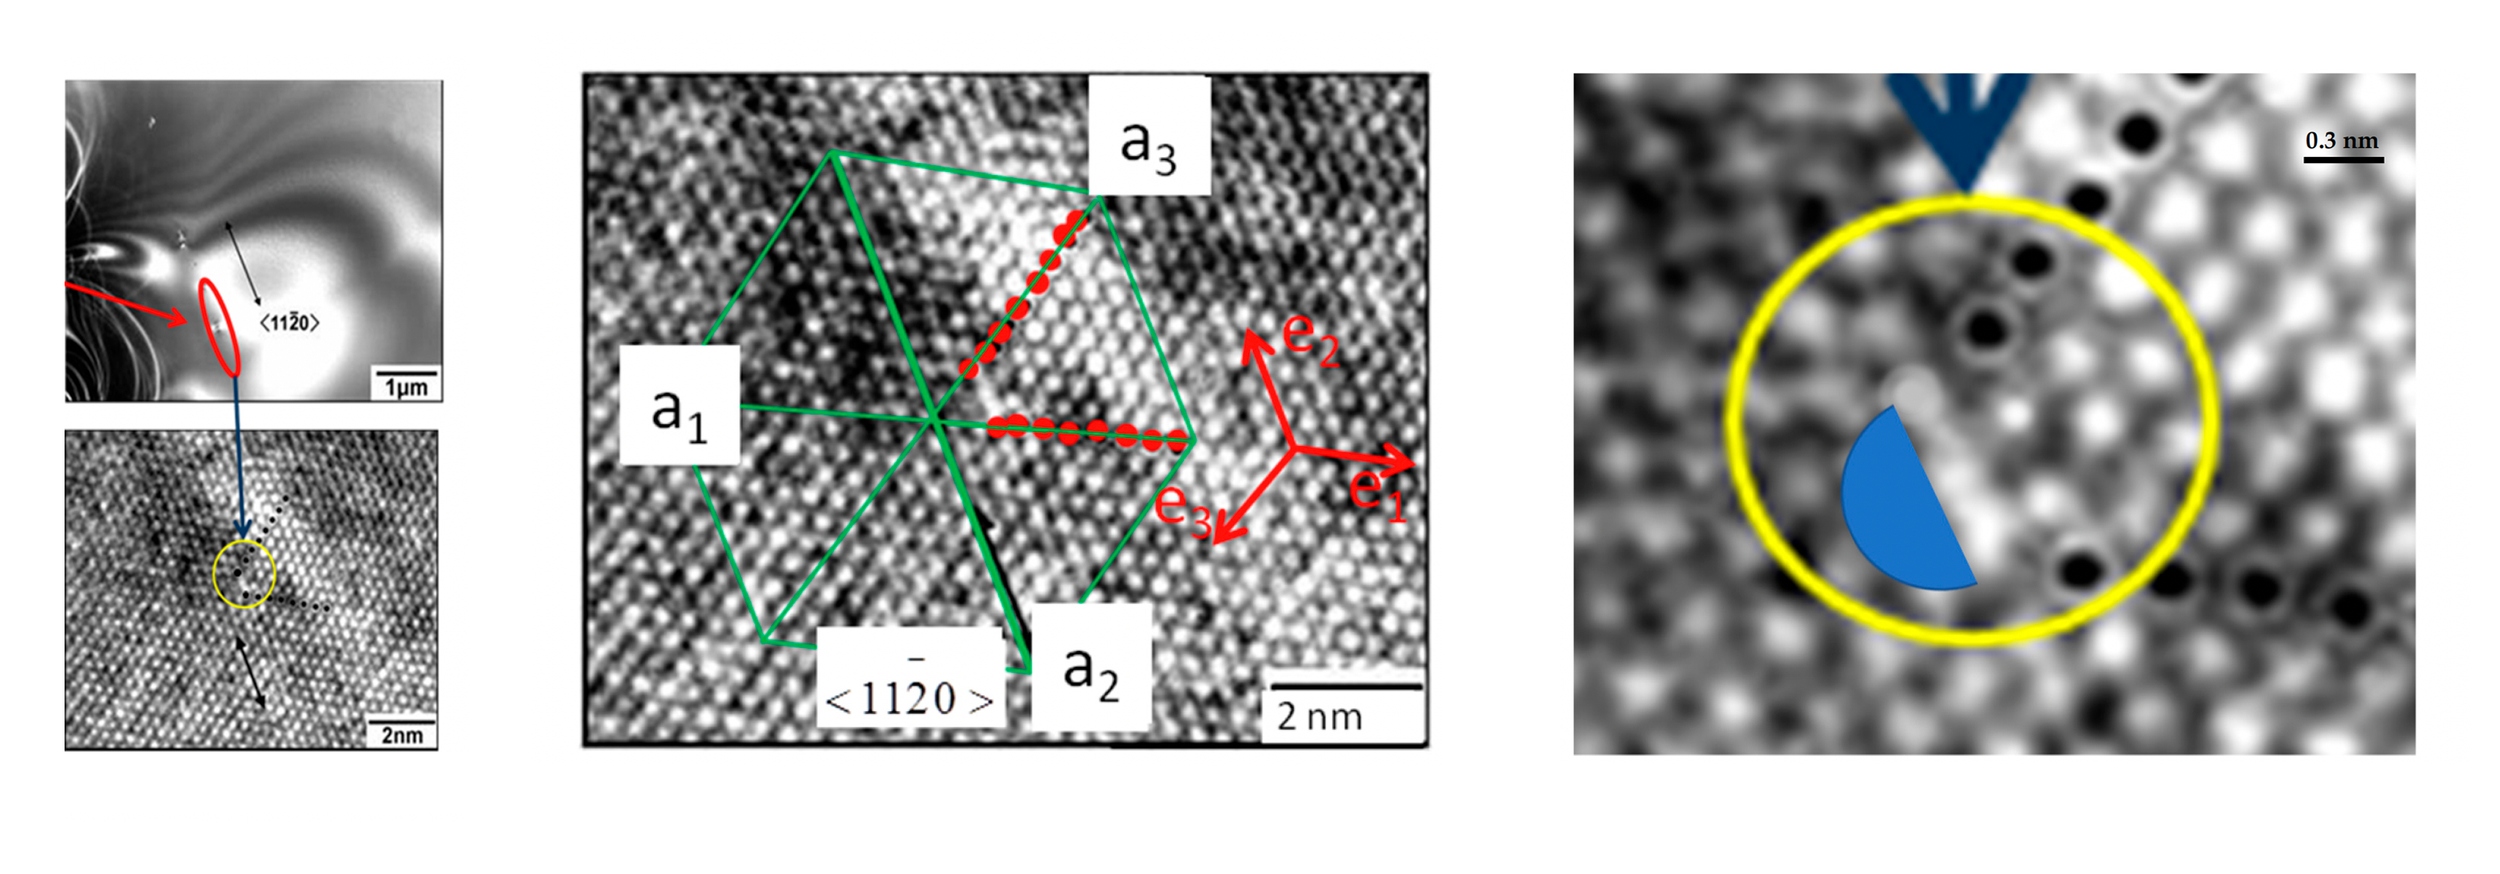
HRTEM images of SiC dislocation
Holomoiré SiC Sim Library
The Holomoire SiC Sim Library is our developing collection of computational tools for exploring this measurement chain. Its current browser workbench lets a student prescribe a pattern change, generate an image, reconstruct displacement from that image, and compare the reconstruction with the prescribed answer. Reusable Python functions perform the scientific calculations.
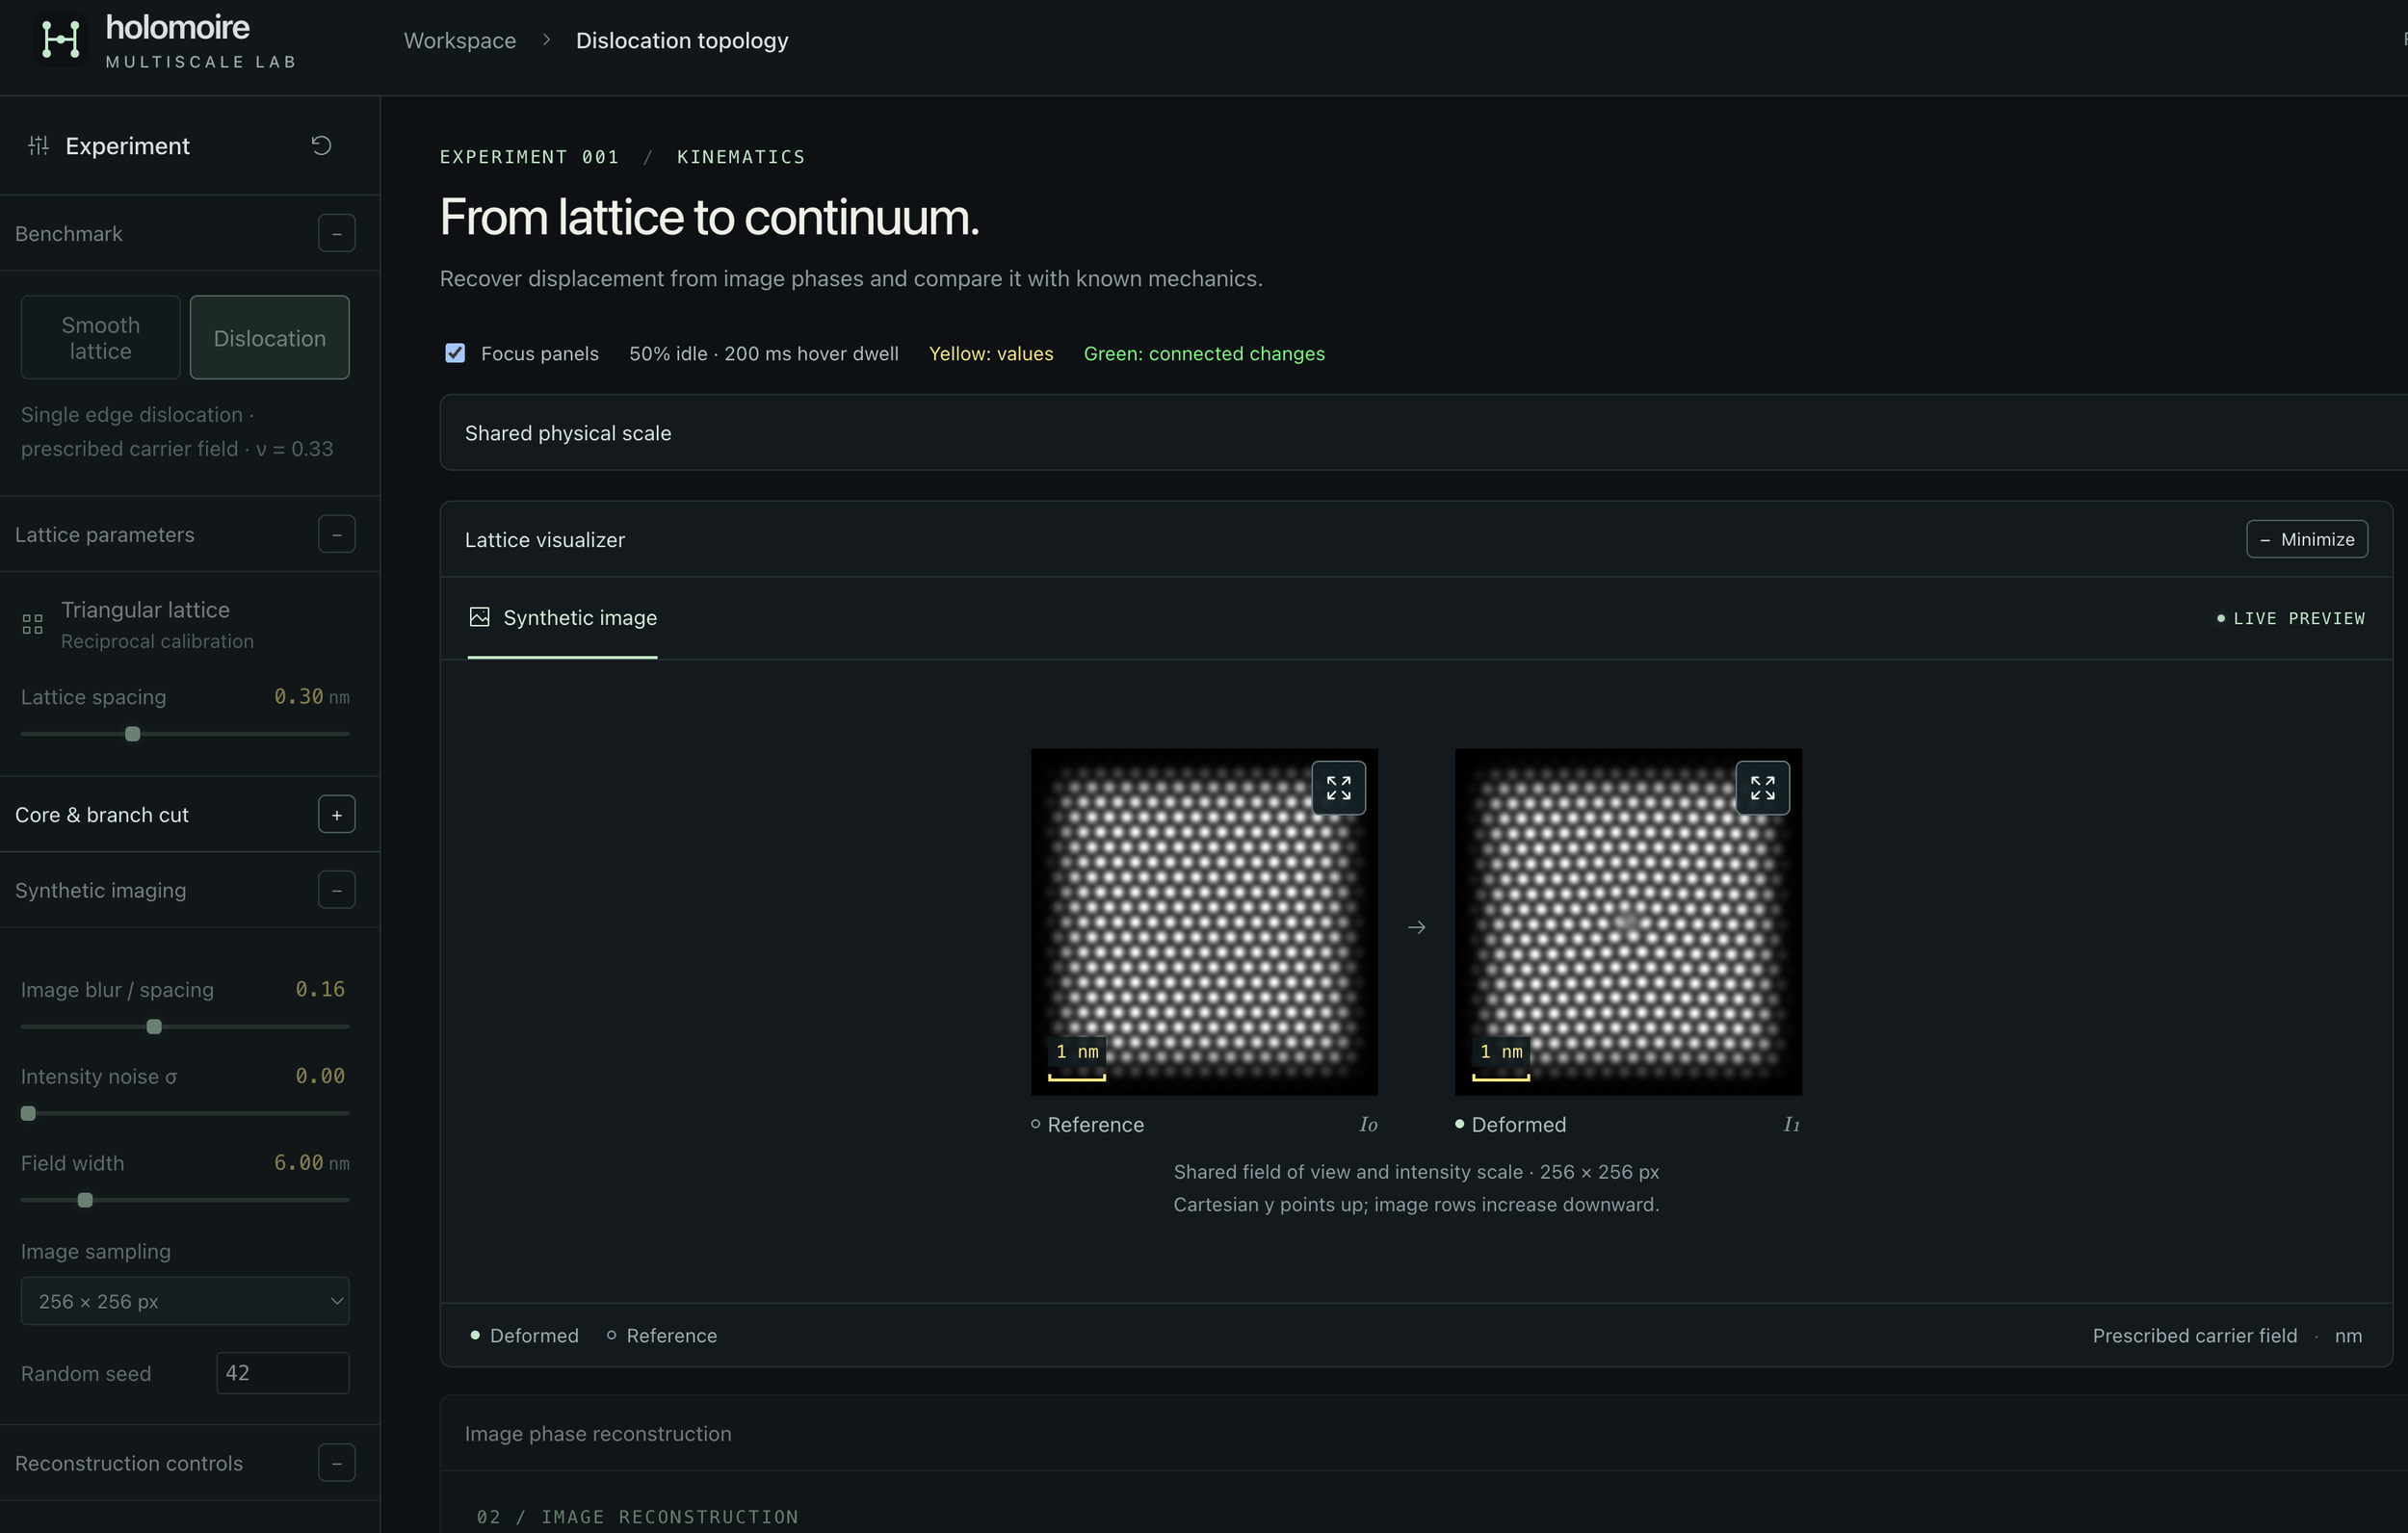
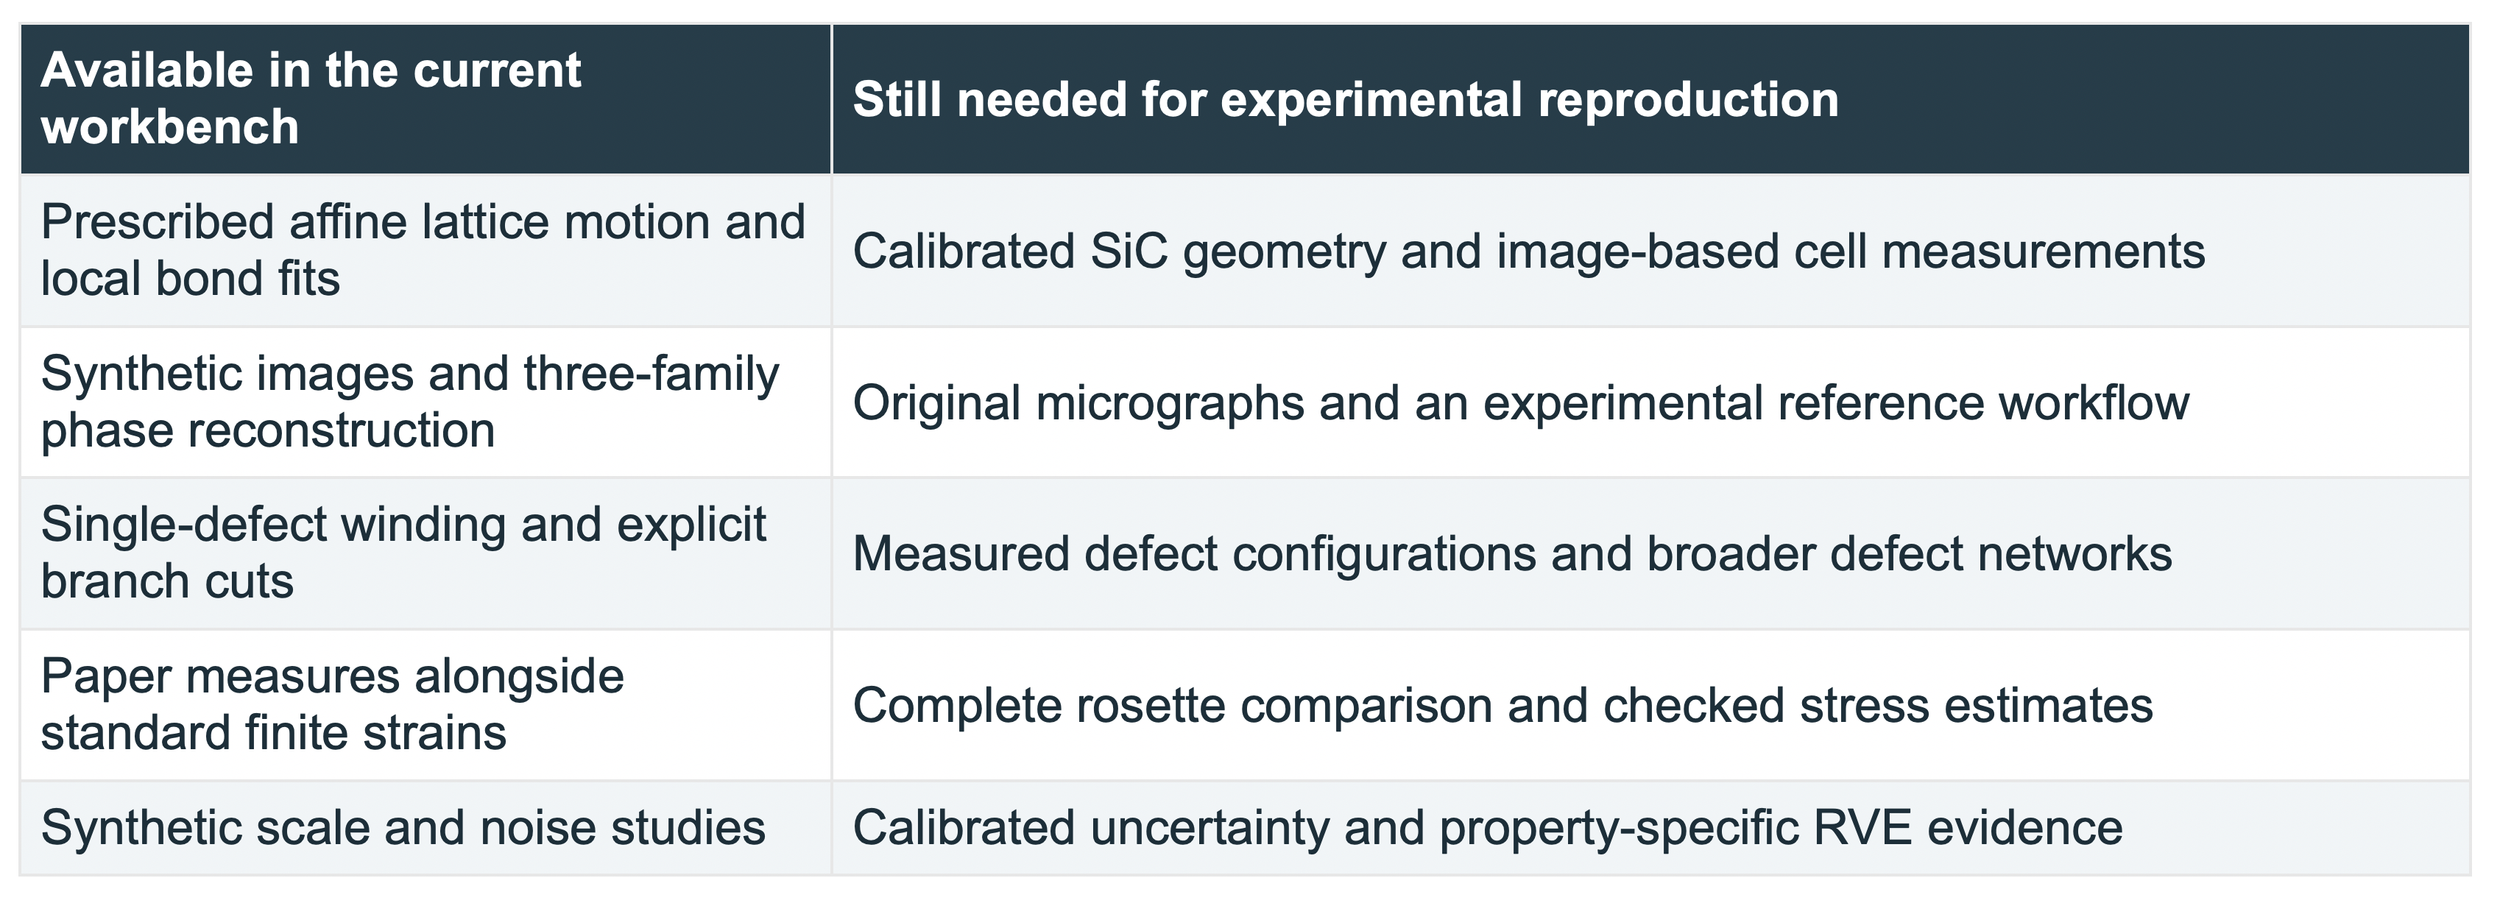
The library connects the objects introduced in this guide: motifs and lattice geometry, transformations, directional carriers, phase, displacement, strain, and analysis scale. Its present synthetic lattice is illustrative. The SiC name identifies the research direction; the current release is not a calibrated 4H-SiC simulator or a completed reproduction of the paper.
Three first experiments
1. Translate and rotate. Compare the zero strain from exact bond geometry with the small errors in image-derived strain. Change the translation anchor to see why periodic images leave lattice-period ambiguity.
2. Stretch and recover. Prescribe a small stretch, reconstruct it from the image, and compare the recovered field with the known field. Increase noise or change the Fourier bandwidth. Read the error together with the valid area.
3. Inspect a dislocation. Follow the directional phases around the core and move the branch cut. Compare local strain away from exclusions, then disable the cut to see why the solver refuses an unresolved singular domain.
Sources for further study
[1] C. A. Sciammarella, F. M. Sciammarella, and L. Lamberti. Determination of Displacement Fields at the Sub-Nanometric Scale. Materials 12, 1804 (2019). Primary scientific reference. Read source
[2] B. Wuensch. Introduction to Crystallography Part 1. MIT OpenCourseWare, 3.60, Fall 2005. A geometry-led introduction to patterns and transformations. Read source
[3] B. Wuensch. Translation Rotation Periodicity Part 1. MIT OpenCourseWare, 3.60, Fall 2005. Translation, motifs, and the distinction between lattice points and atoms. Read source
[4] M. J. Hytch, E. Snoeck, and R. Kilaas. Quantitative measurement of displacement and strain fields from HREM micrographs. Ultramicroscopy 74, 131–146 (1998). Fourier-phase reconstruction and imaging limitations. Read source
[5] W. E and P. Ming. Cauchy-Born Rule and the Stability of Crystalline Solids: Static Problems. Archive for Rational Mechanics and Analysis 183, 241–297 (2007). Conditional mathematical connection between atomistic and continuum elasticity. Read source